Chainlink dropped from a high of $14.83 in the past 24 hours to a low of $13.04 and has recovered to the current price of $13.59 in less than 12 hours. The total market capitalization of LINK is around $5.4 billion, around $60 million short of surpassing Bitcoin Cash and really close to Litecoin as well.
Chainlink Price Awaits A Clear Breakout
The most important pattern on the daily chart is the ascending parallel channel. A breakout above the upper trendline at $17 could quickly drive LINK’s price above $20, establishing a new all-time high.
On the other hand, a breakdown below the lower boundary of the pattern would push Chainlink to the psychological support level at $10.
Looking at the 4-hour chart, we can determine the most likely trend for the next few days. So far, bulls have been able to defend the uptrend despite a widespread crash of the market today.
Holding the crucial support level at $13.7, which is the 26-EMA is essential to defend the uptrend. The last low is located at $12.85 and the high at $14.83. Bulls are aiming to set a higher high and a higher low.
The MACD remains bullish but seems to be on the verge of a bearish cross for the first time since November 25. On the other hand, the RSI has cooled off significantly. Most technicals suggest investors to sell on the 4-hour chart but indicate the digital asset remains strong on the daily, weekly, and monthly charts.
When it comes to on-chain metrics, the In/Out of the Money Around Price chart (IOMAP) shows practically no resistance to the upside until $15.65 but a lot of support on the way down.
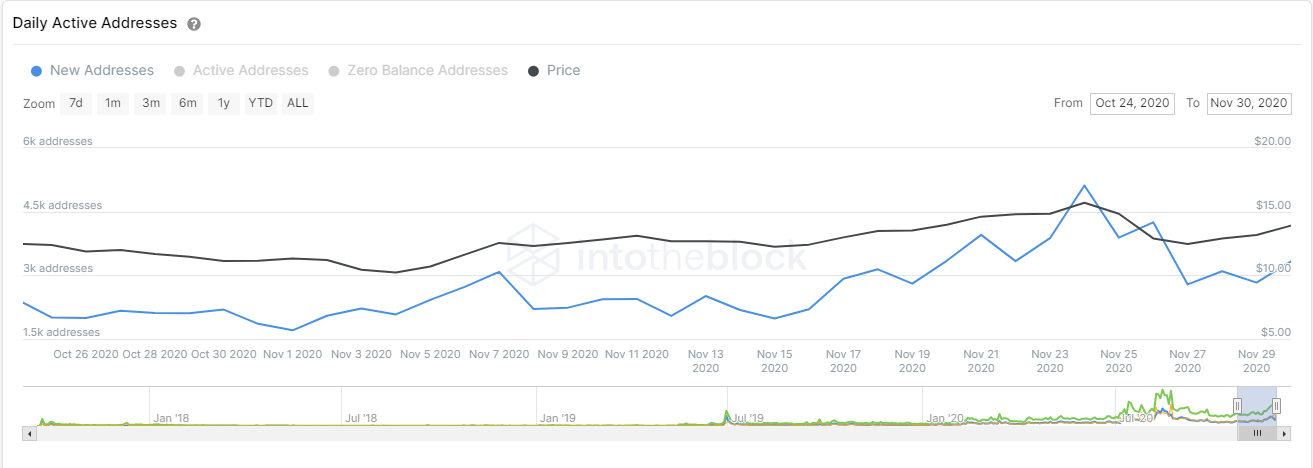
 The number of new addresses joining the network had a significant spike on November 24 reaching 5,120 per day and has dropped to 3,330 now but remains in an uptrend since the beginning of the month.
Make sure to join our Trading Group on Telegram for more awesome tips!  Chainlink Price Analysis© Cryptoticker