Bitcoin has been predicted to go bullish in the long run, as short-term obstacles overthrowing the anticipated bull run for a later time (next year, according to numerous analytic predictions), have taken up space in the market. Still, the bullish predictions stay flooding in and future price prediction is now expected to surpass $200,000, according to some bullish on-chain metrics that was shared by Rafael Shultze-Kraft, the chief technical officer of the on-chain analytics aggregator Glassnode.
Through a Twitter thread, in which he explains the reasons why he considers six market indicators “insanely bullish.” Terming the market metrics as some of the most important on-chain indictors, Shultze-Kraft notes that the possibility of Bitcoin rising 10x in price hinges on when the indicators imitate the 2017 Bitcoin market movement by reaching the highest levels, though most of these indicators are still “far from the top” he notes.
$328,000 is the most bullish price estimated thus far, according to the long-term holder SPOR (spent output profit ratio) indicator. If this signal, which accesses long-term investor behavior, makes an up climb to exactly 1,620% today, as it did in 2017 which led to prices hitting new all-time highs that year, Bitcoin is expected to hit the aforementioned price mark. However, the indicator must surge by 87% going forward, in order for history to repeat itself.
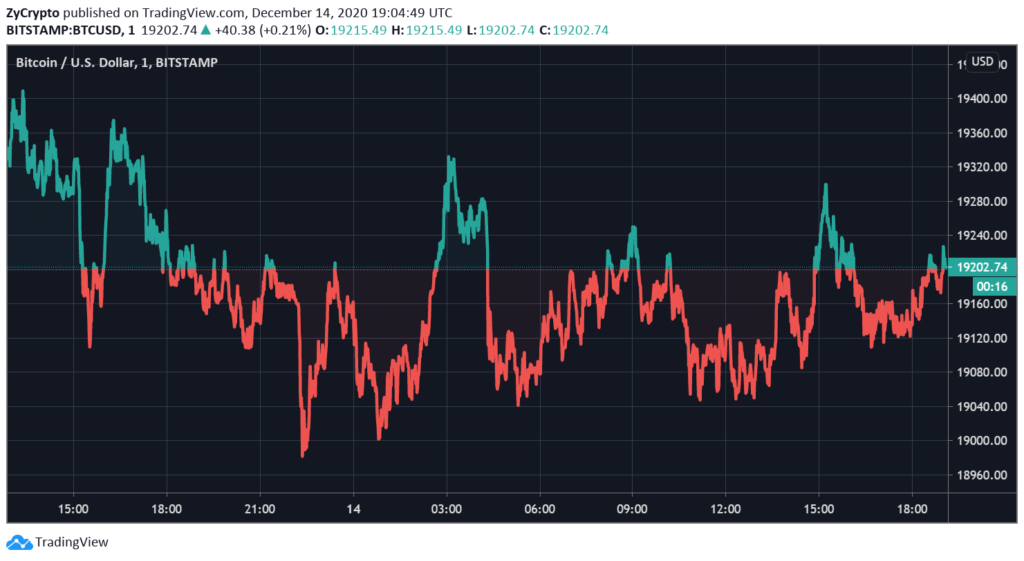
 BTCUSD Chart By TradingView
The net unrealized profit and loss indicator signals the second-highest Bitcoin price mark of $286,000, given that the 1,400% increase made in 2017 is repeated today. Currently at 78% from 2017, the indicator is the closest to toppling the 3-year-old peak.
A 1,340% increase today will see the price estimation of the Long-Term Holder MVRV indicator, which is currently 13% away from its ATH three years ago come alive. $274,000 is the estimated price that could be attained.
Interestingly, two other indicators are coincidentally signaling a Bitcoin price breakout to $240,000. The MVRV Z-Score indicator is only 34% away from its 2017 level, a 1,150% upsurge sent it to new highs in 2017, a follow-up on the same pattern will replay history. The reserve risk indicator, although still significantly lower at 11% today, should cause the same $240,000 price outcome, should it be accompanied by a 1,180% increase.
At 25% away from the 2017 peak, the Market Cap to Thermo Cap Ratio signals a $138,000 price, on the condition that a 625% up climb is historically repeated. Despite being the only indicator hinting at an ATH below $200,000, the market will still benefit significantly, should this price mark or even half of it be recorded.
As a disclaimer, Shultze-Kraft recalls that all of the aforementioned is only from a “single data point.” The indicators, still very far away from their 2017 peak sum up a similar sentiment from Glassnode’s last weekly data report which noted that a price retracement will come before any anticipated rally.