Binance Coin has been relatively stable the past week, however, the recent US Traders Ban from Binance made BNB plummet below two important support levels, the $20 psychological support level and the $19.65 EMA support level on the Monthly chart.
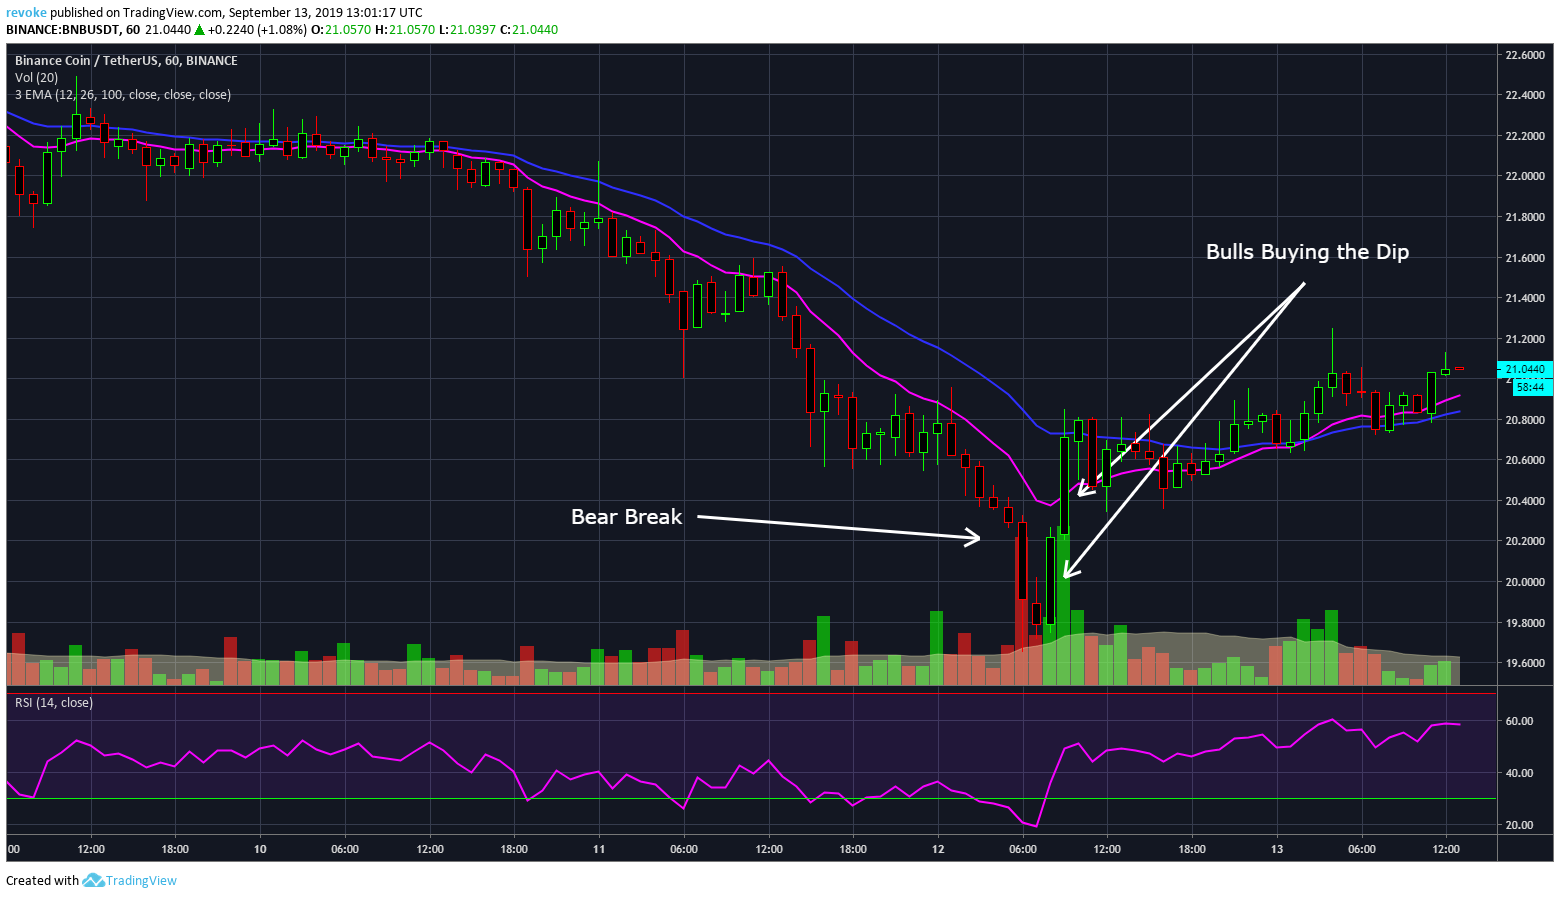
Thankfully for the BNB, the bear move didn’t last long and the bulls were able to create a nice rebound. The big bearish move took place over two hours followed by another two hours of bullish action. The bulls have been able to break above the 12-Day EMA on the 4-Hour chart and are now trying to break above the 26-Day EMA in a confirmed uptrend.
Similarly, the Hourly chart is in a confirmed steady uptrend with a bull cross of the EMA’s. The RSI is not yet in the overbought area which means that the bulls still have more room for growth.

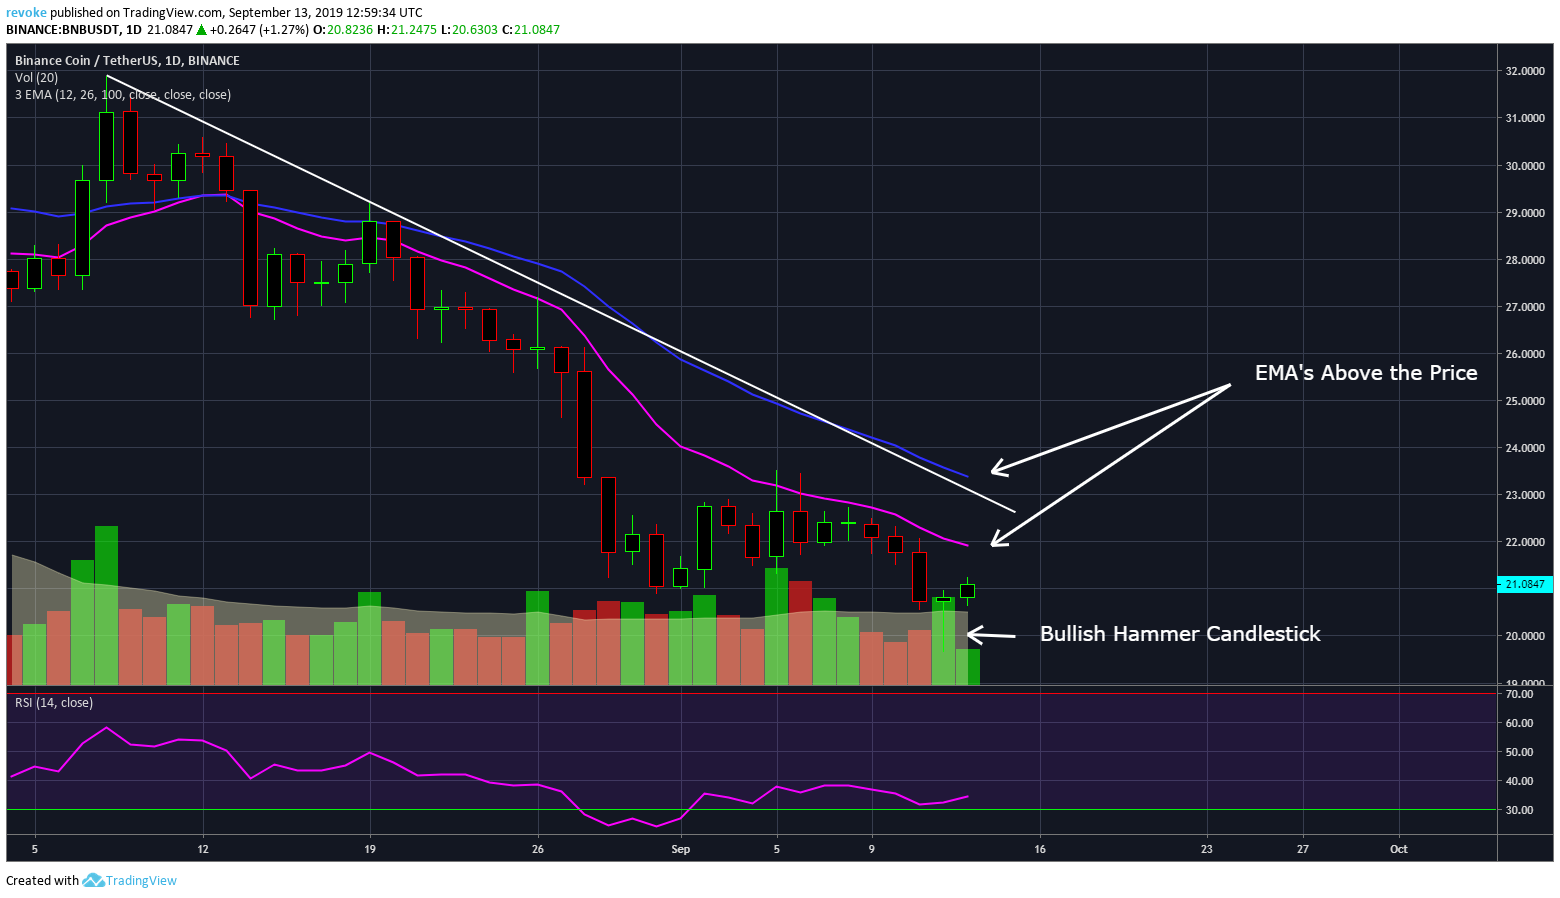
The daily chart has formed a nice bullish Hammer Candlestick which could see a lot of continuation today or tomorrow if the bulls keep up the momentum. The daily chart is still in a downtrend and BNB is trading below both EMA’s, however, the RSI is near the oversold area which could help the bulls.
It’s also important to note that Binance is planning to open registration and deposits of their new U.S. exchange on September 18, although trading will commence later.

The weekly chart continues in a downtrend as well and the EMA’s are far away at $24.68 and $26.54 respectively. In contrast, the Monthly chart continues in a huge uptrend and the bulls are still showing strength after defending the 12-Day EMA.
The volume also indicates a lot of strength for the bulls as the recent bearish months have been lead by a decline in volume in contrast to the huge volume increase in the bullish months.
The post Binance Coin (BNB) Price Takes Quick Recovery From Under $20 appeared first on ZyCrypto.