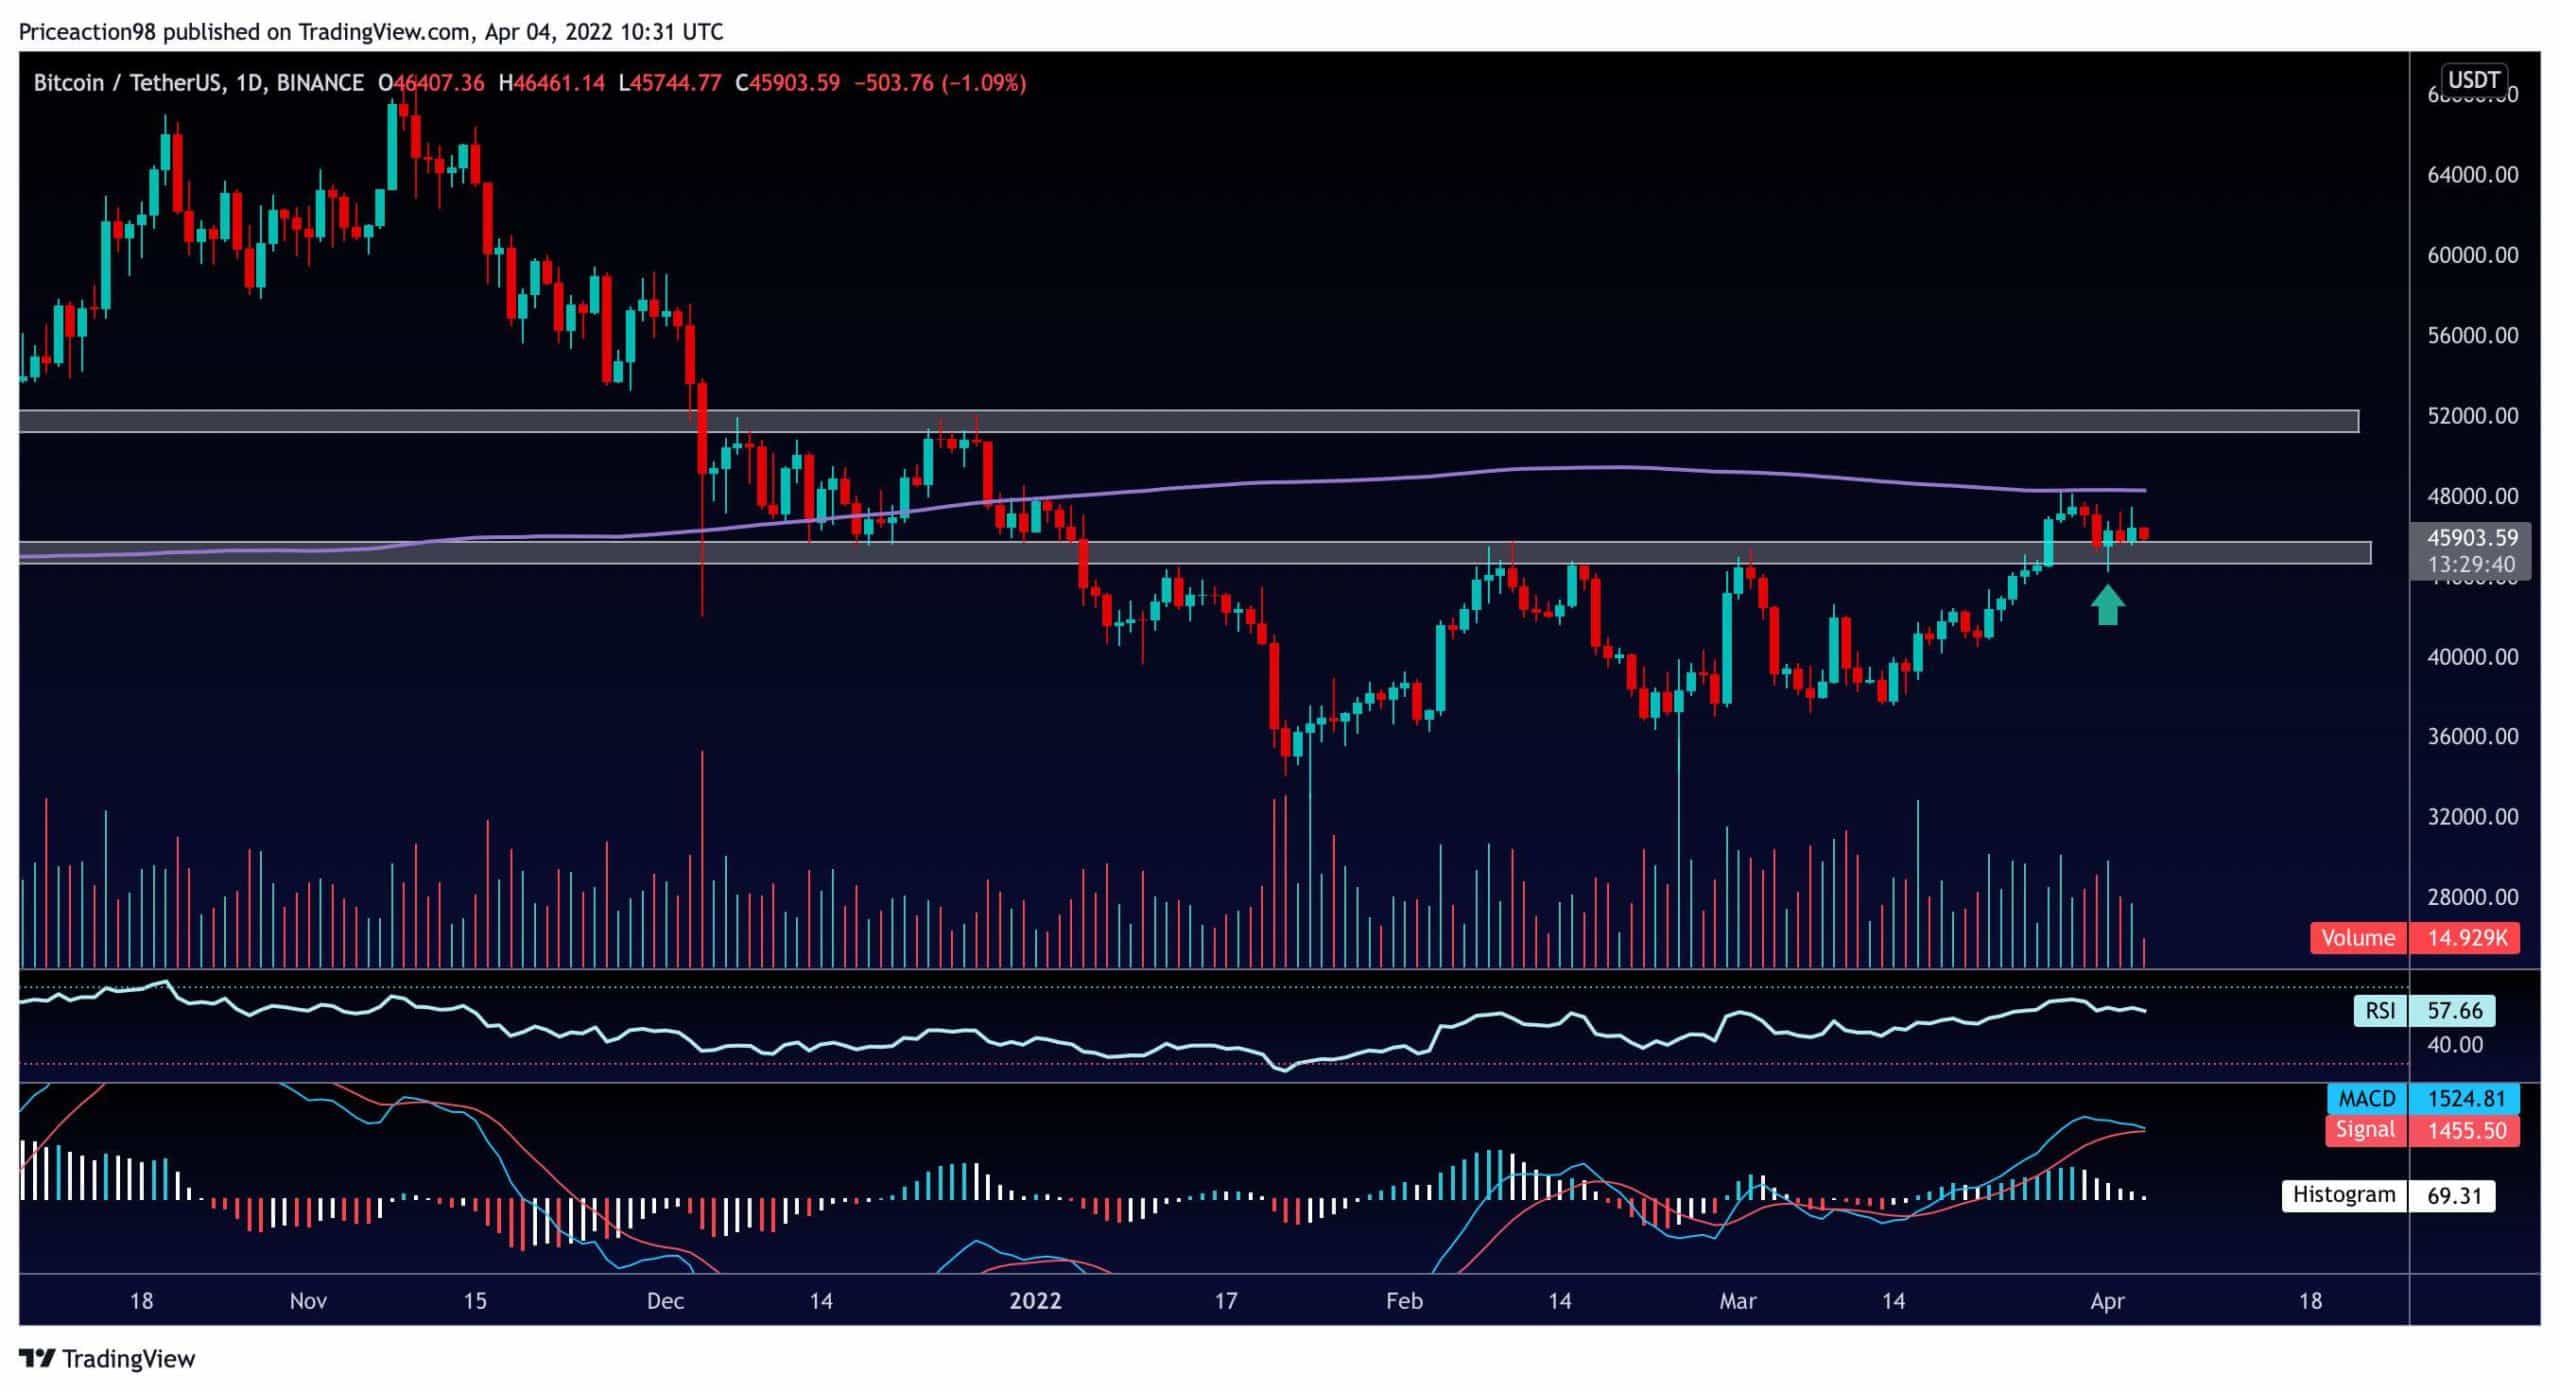
Bitcoin has failed to break above its 200-day moving average – a crucial level for the price and is currently consolidating below it. However, the cryptocurrency experienced a shakeout and dropped below the $45K mark on April 1st, and has recovered after. This move might be considered a necessary pullback for Bitcoin to justify its breakthrough from the $46K critical supply zone.
Technical Analysis
The Daily Chart:
Technical Analysis By Shayan
To keep the rally going, Bitcoin has to chart a higher high in the daily timeframe over $47K – at least in theory. This would confirm that the pullback was valid, and another surge could be in play. The next significant resistance level will be around $52K, while the next support level will be about $37K.
The 4-Hour Chart:
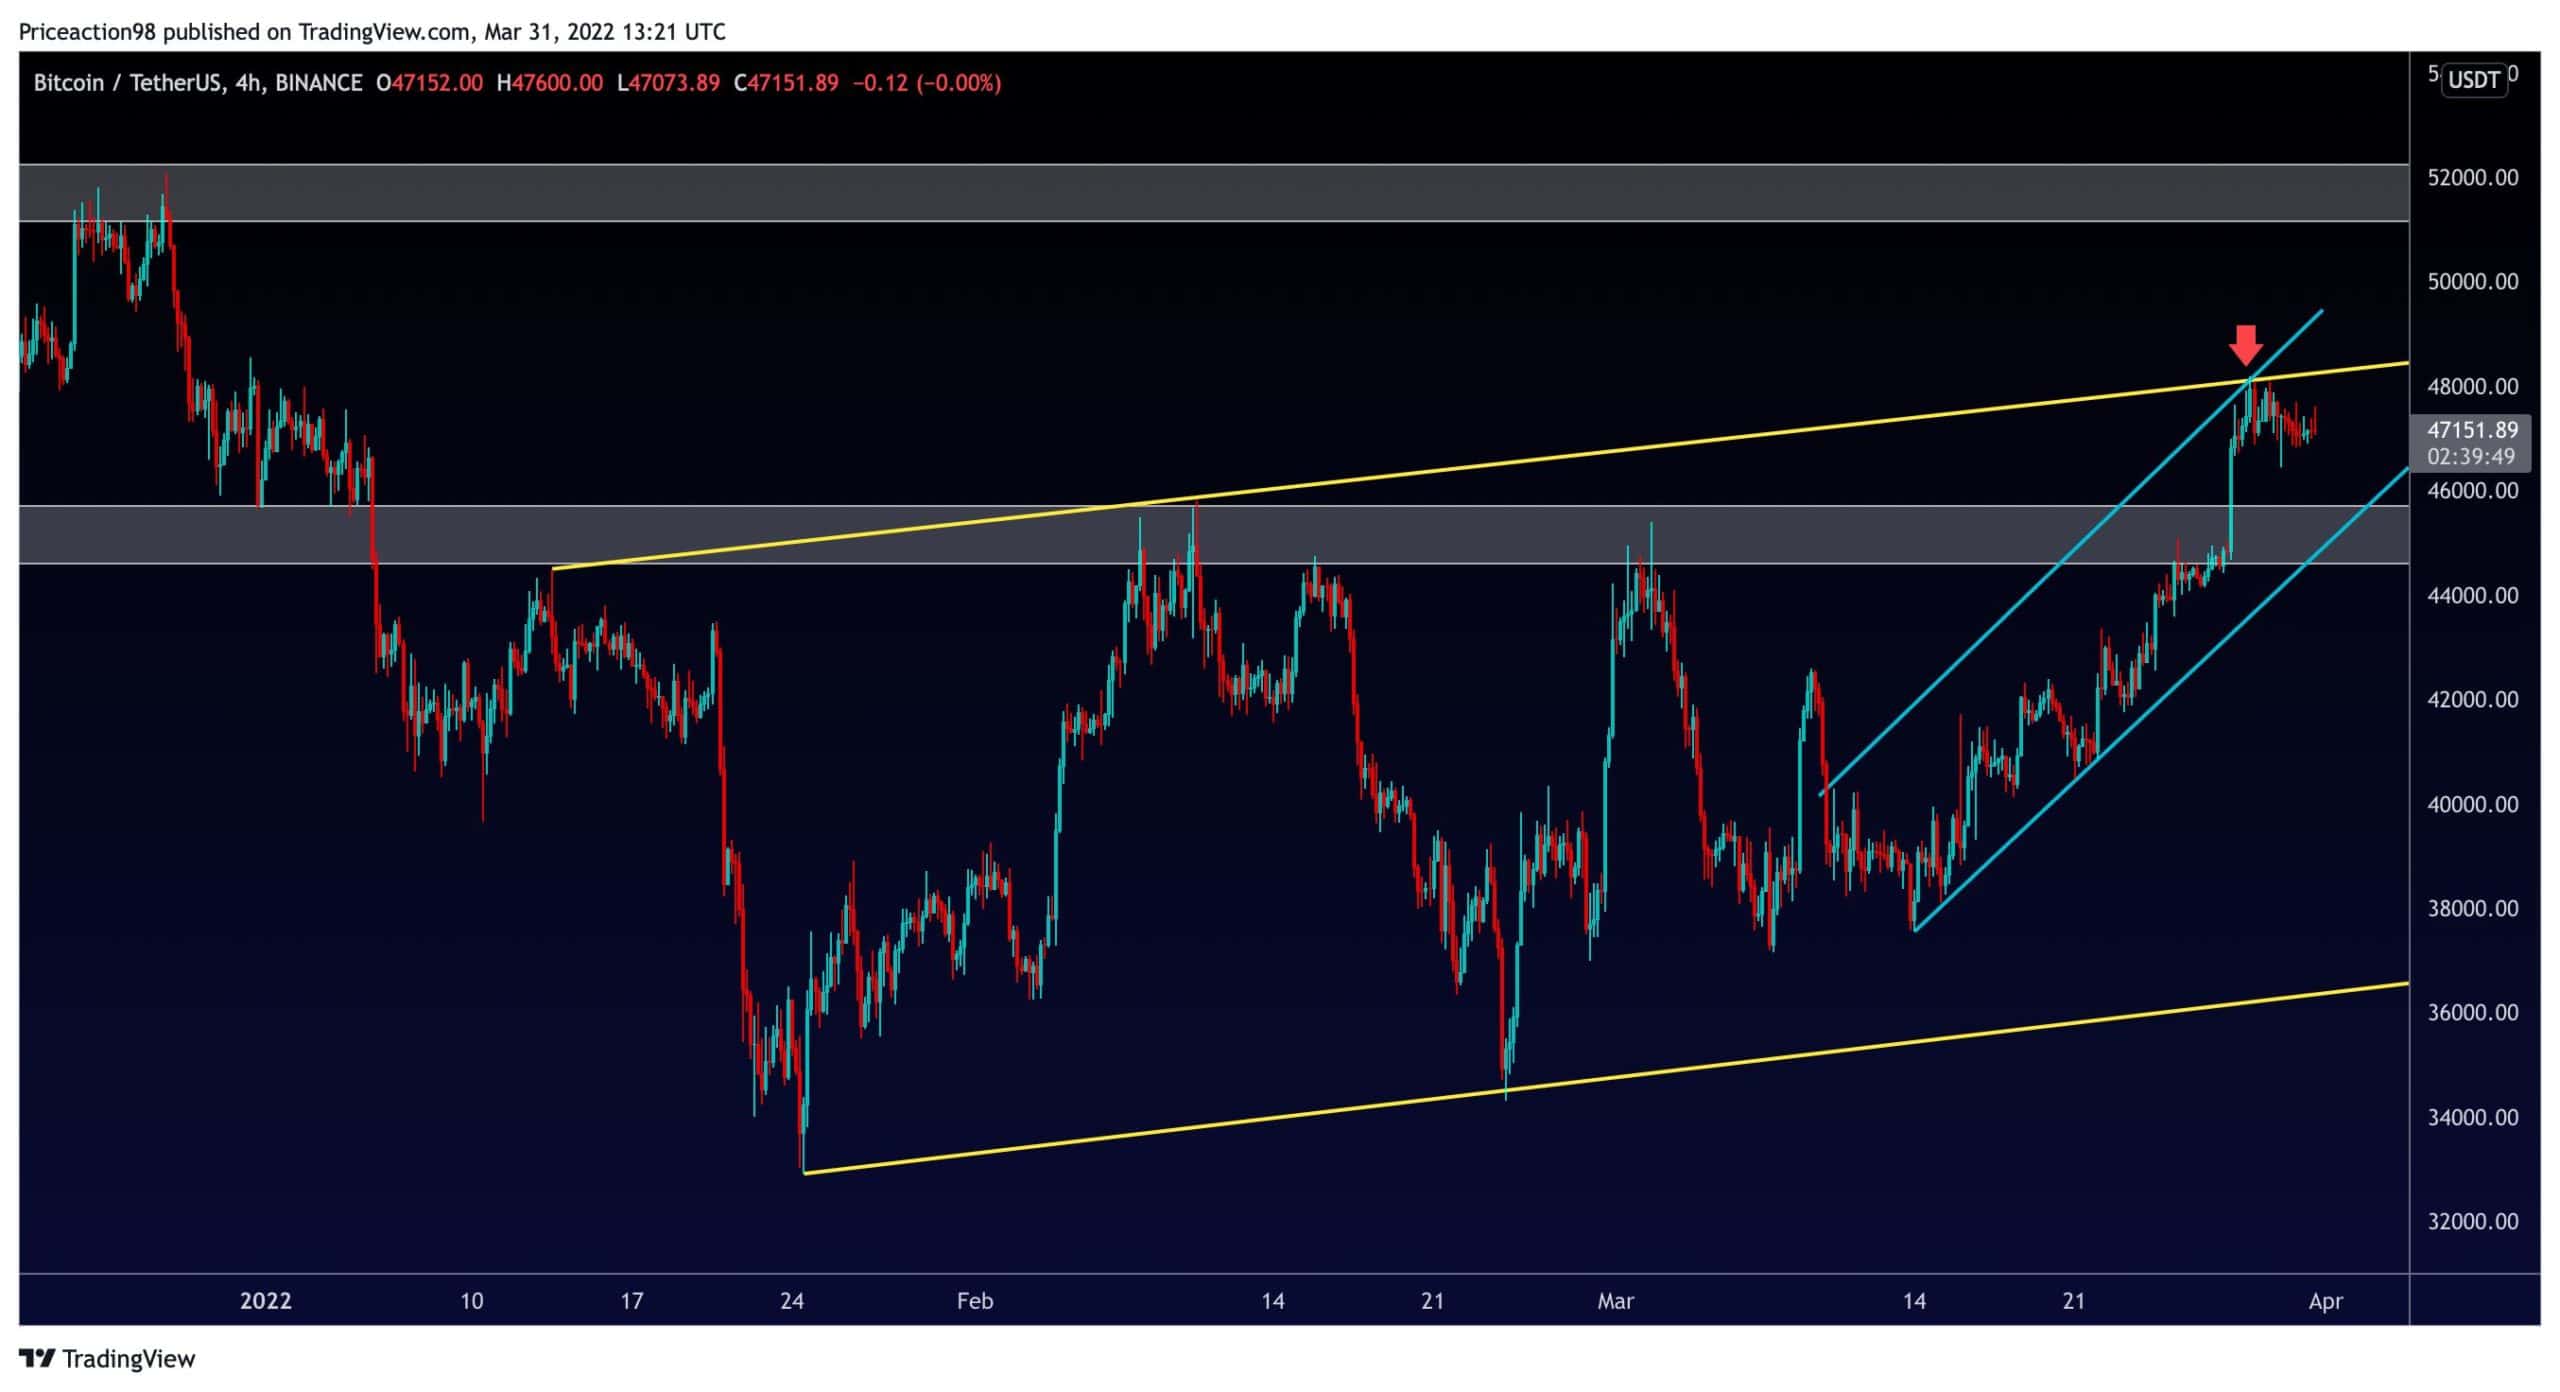
Bitcoin has been rejected from the upper trendline of the referenced channel in the lower timeframes and plummeted below the $45K level. However, the price has failed to create a lower low and has remained sustained, indicating a clear bullish sign.
Following the expansion phase that started from the $37K level and continued to $48K, Bitcoin’s price seems likely to have entered a consolidation/range period between the $45K and the $48K resistance level.
If the $45K demand level is breached, the channel’s midline and $37K will be the following levels of support. Also, If the price succeeds in breaking above the $48K resistance level, the following challenge to consider would be $52K.
Future Market Sentiment Analysis
Sentiment Analysis By: Edris
Bitcoin Taker Buy Sell Ratio
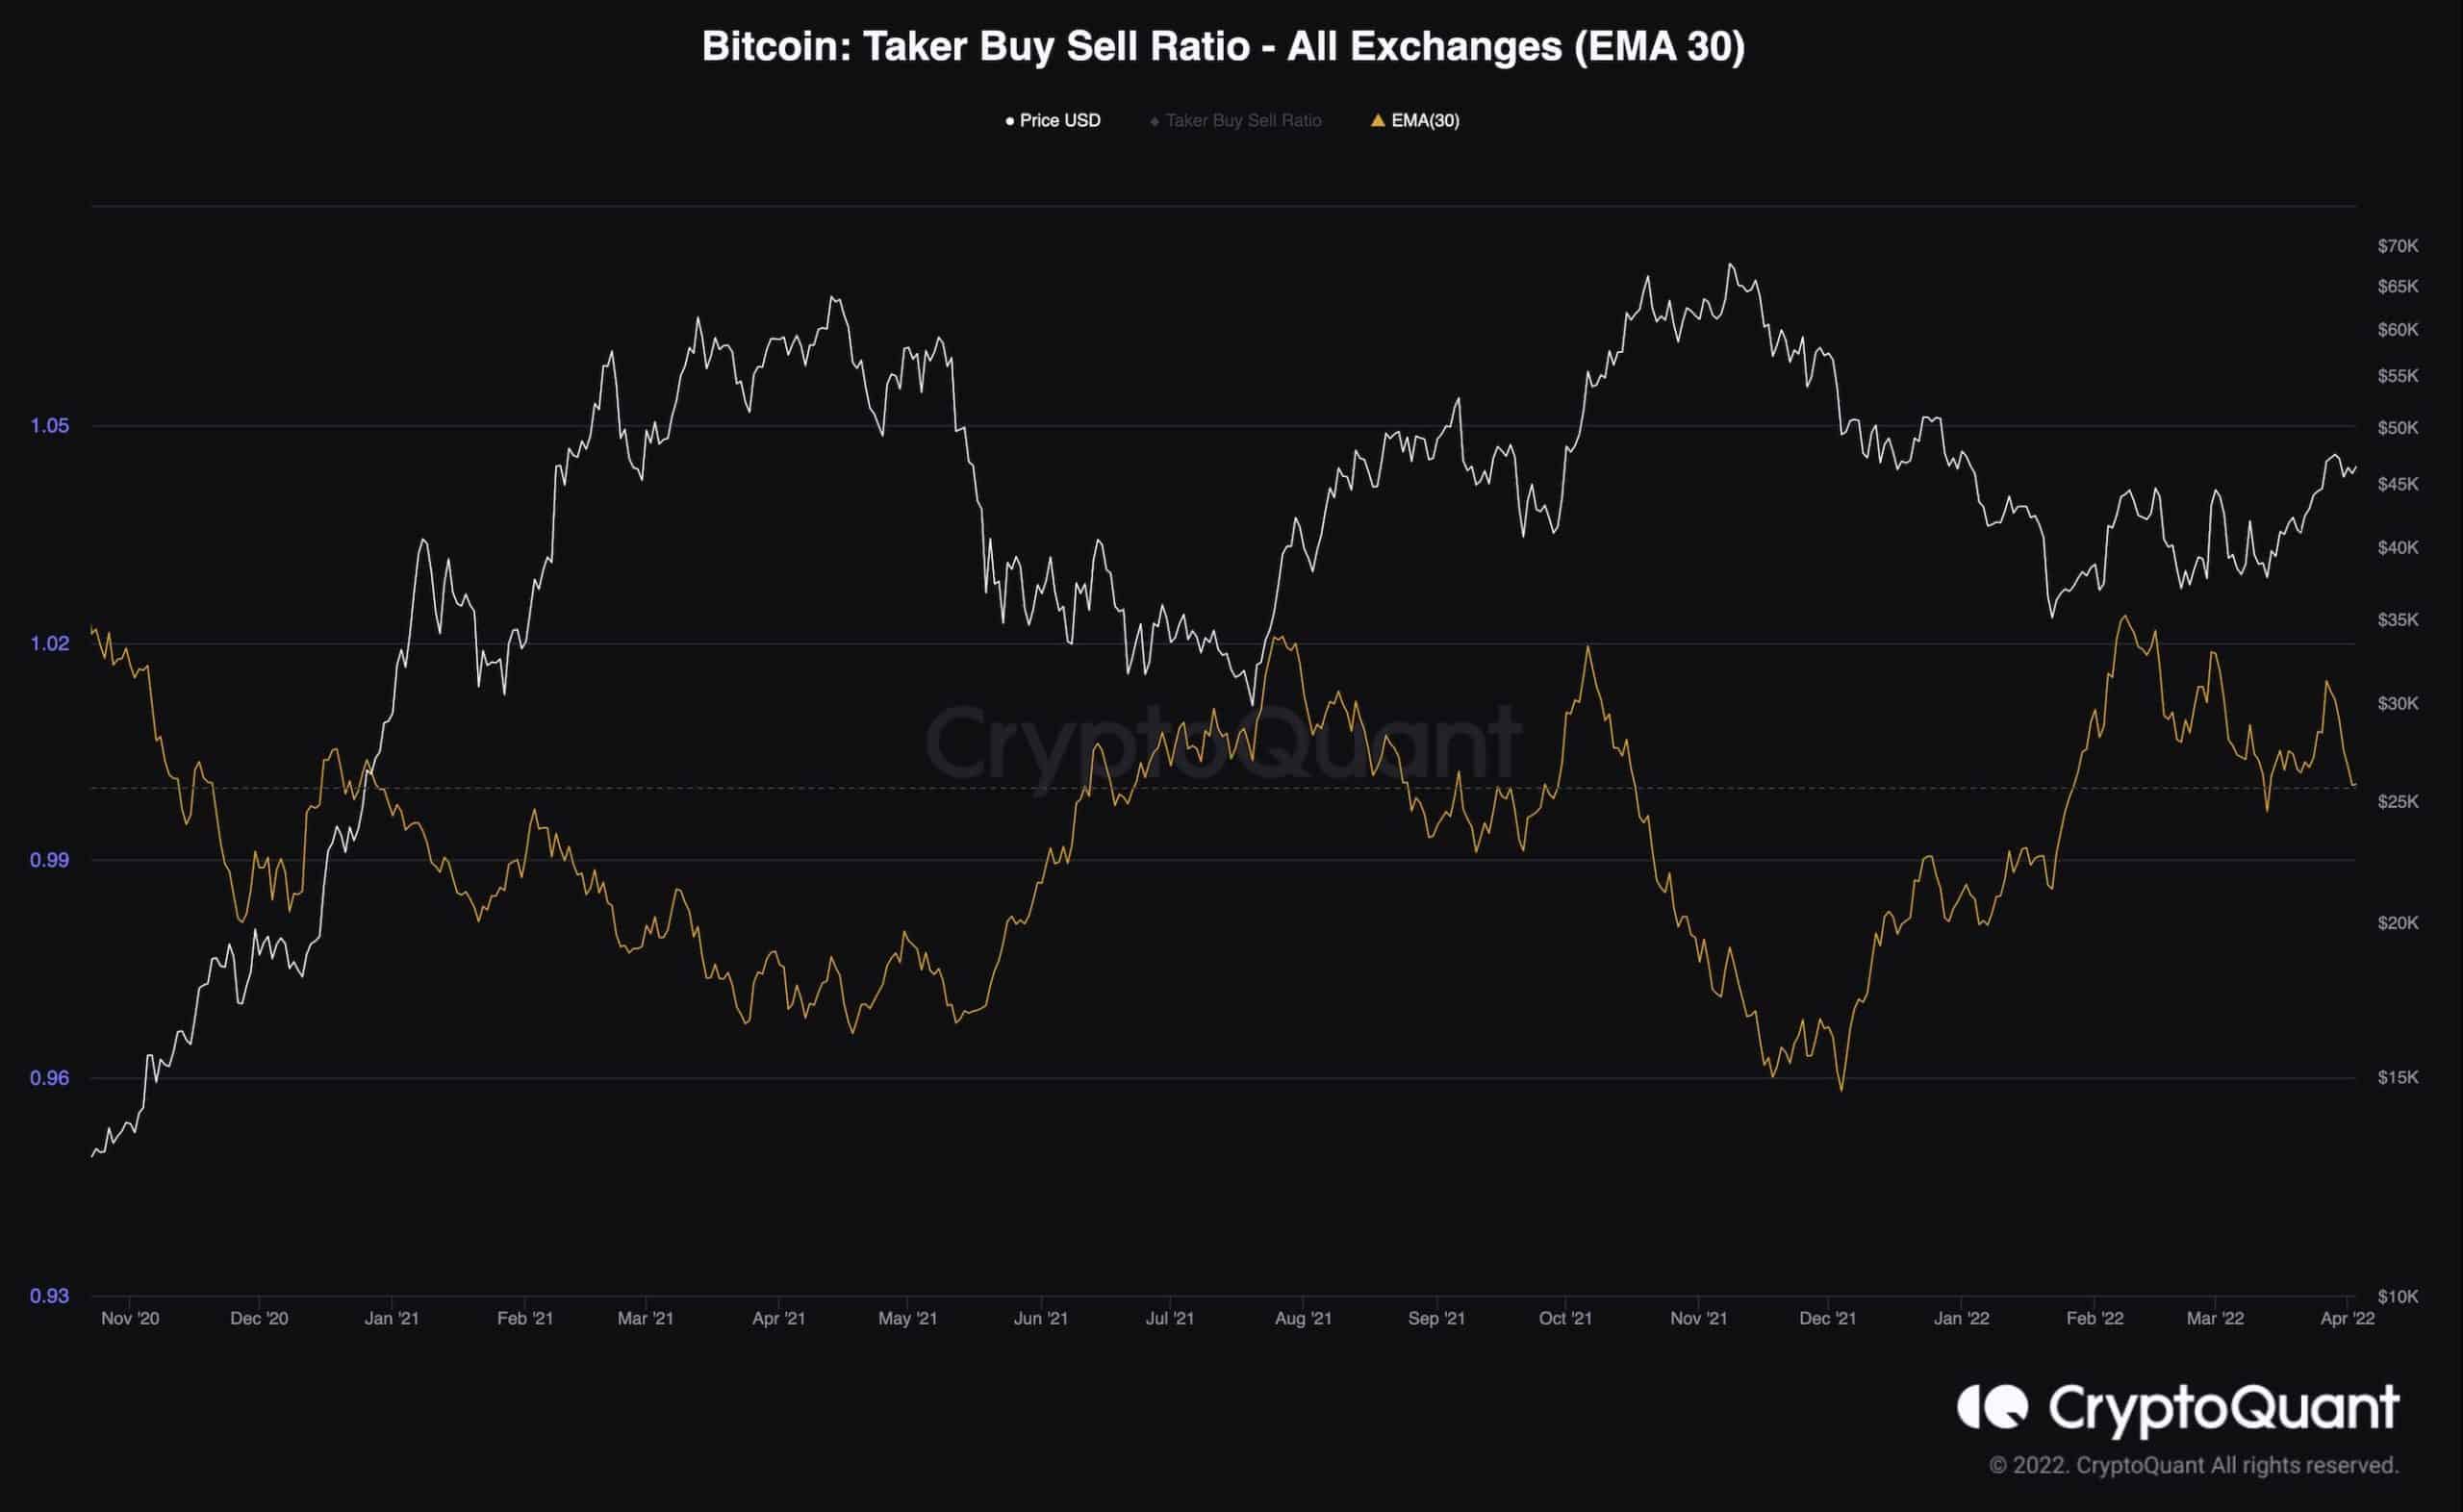
One of the most important metrics to evaluate the perpetual futures market sentiment is the Taker Buy Sell Ratio which shows whether the buyers or the sellers are more aggressive. Values above one show fierce demand, and conversely, values below 1 indicate selling pressure in the perpetual futures market.
The Taker Buy Sell Ratio has been above one after the $33K bottom and indicates that the buyers were dominant. This signal has been validated with the price rallying towards the $48K level in the past few weeks.
However, the metric has broken below 1 in recent days, indicating that the buying pressure is fading. The bulls are taking their profits and covering their long positions, as the bears are beginning to short aggressively. This behavior could signal the beginning of a distribution phase and a drop shortly, so this metric should be monitored closely in the upcoming weeks.


