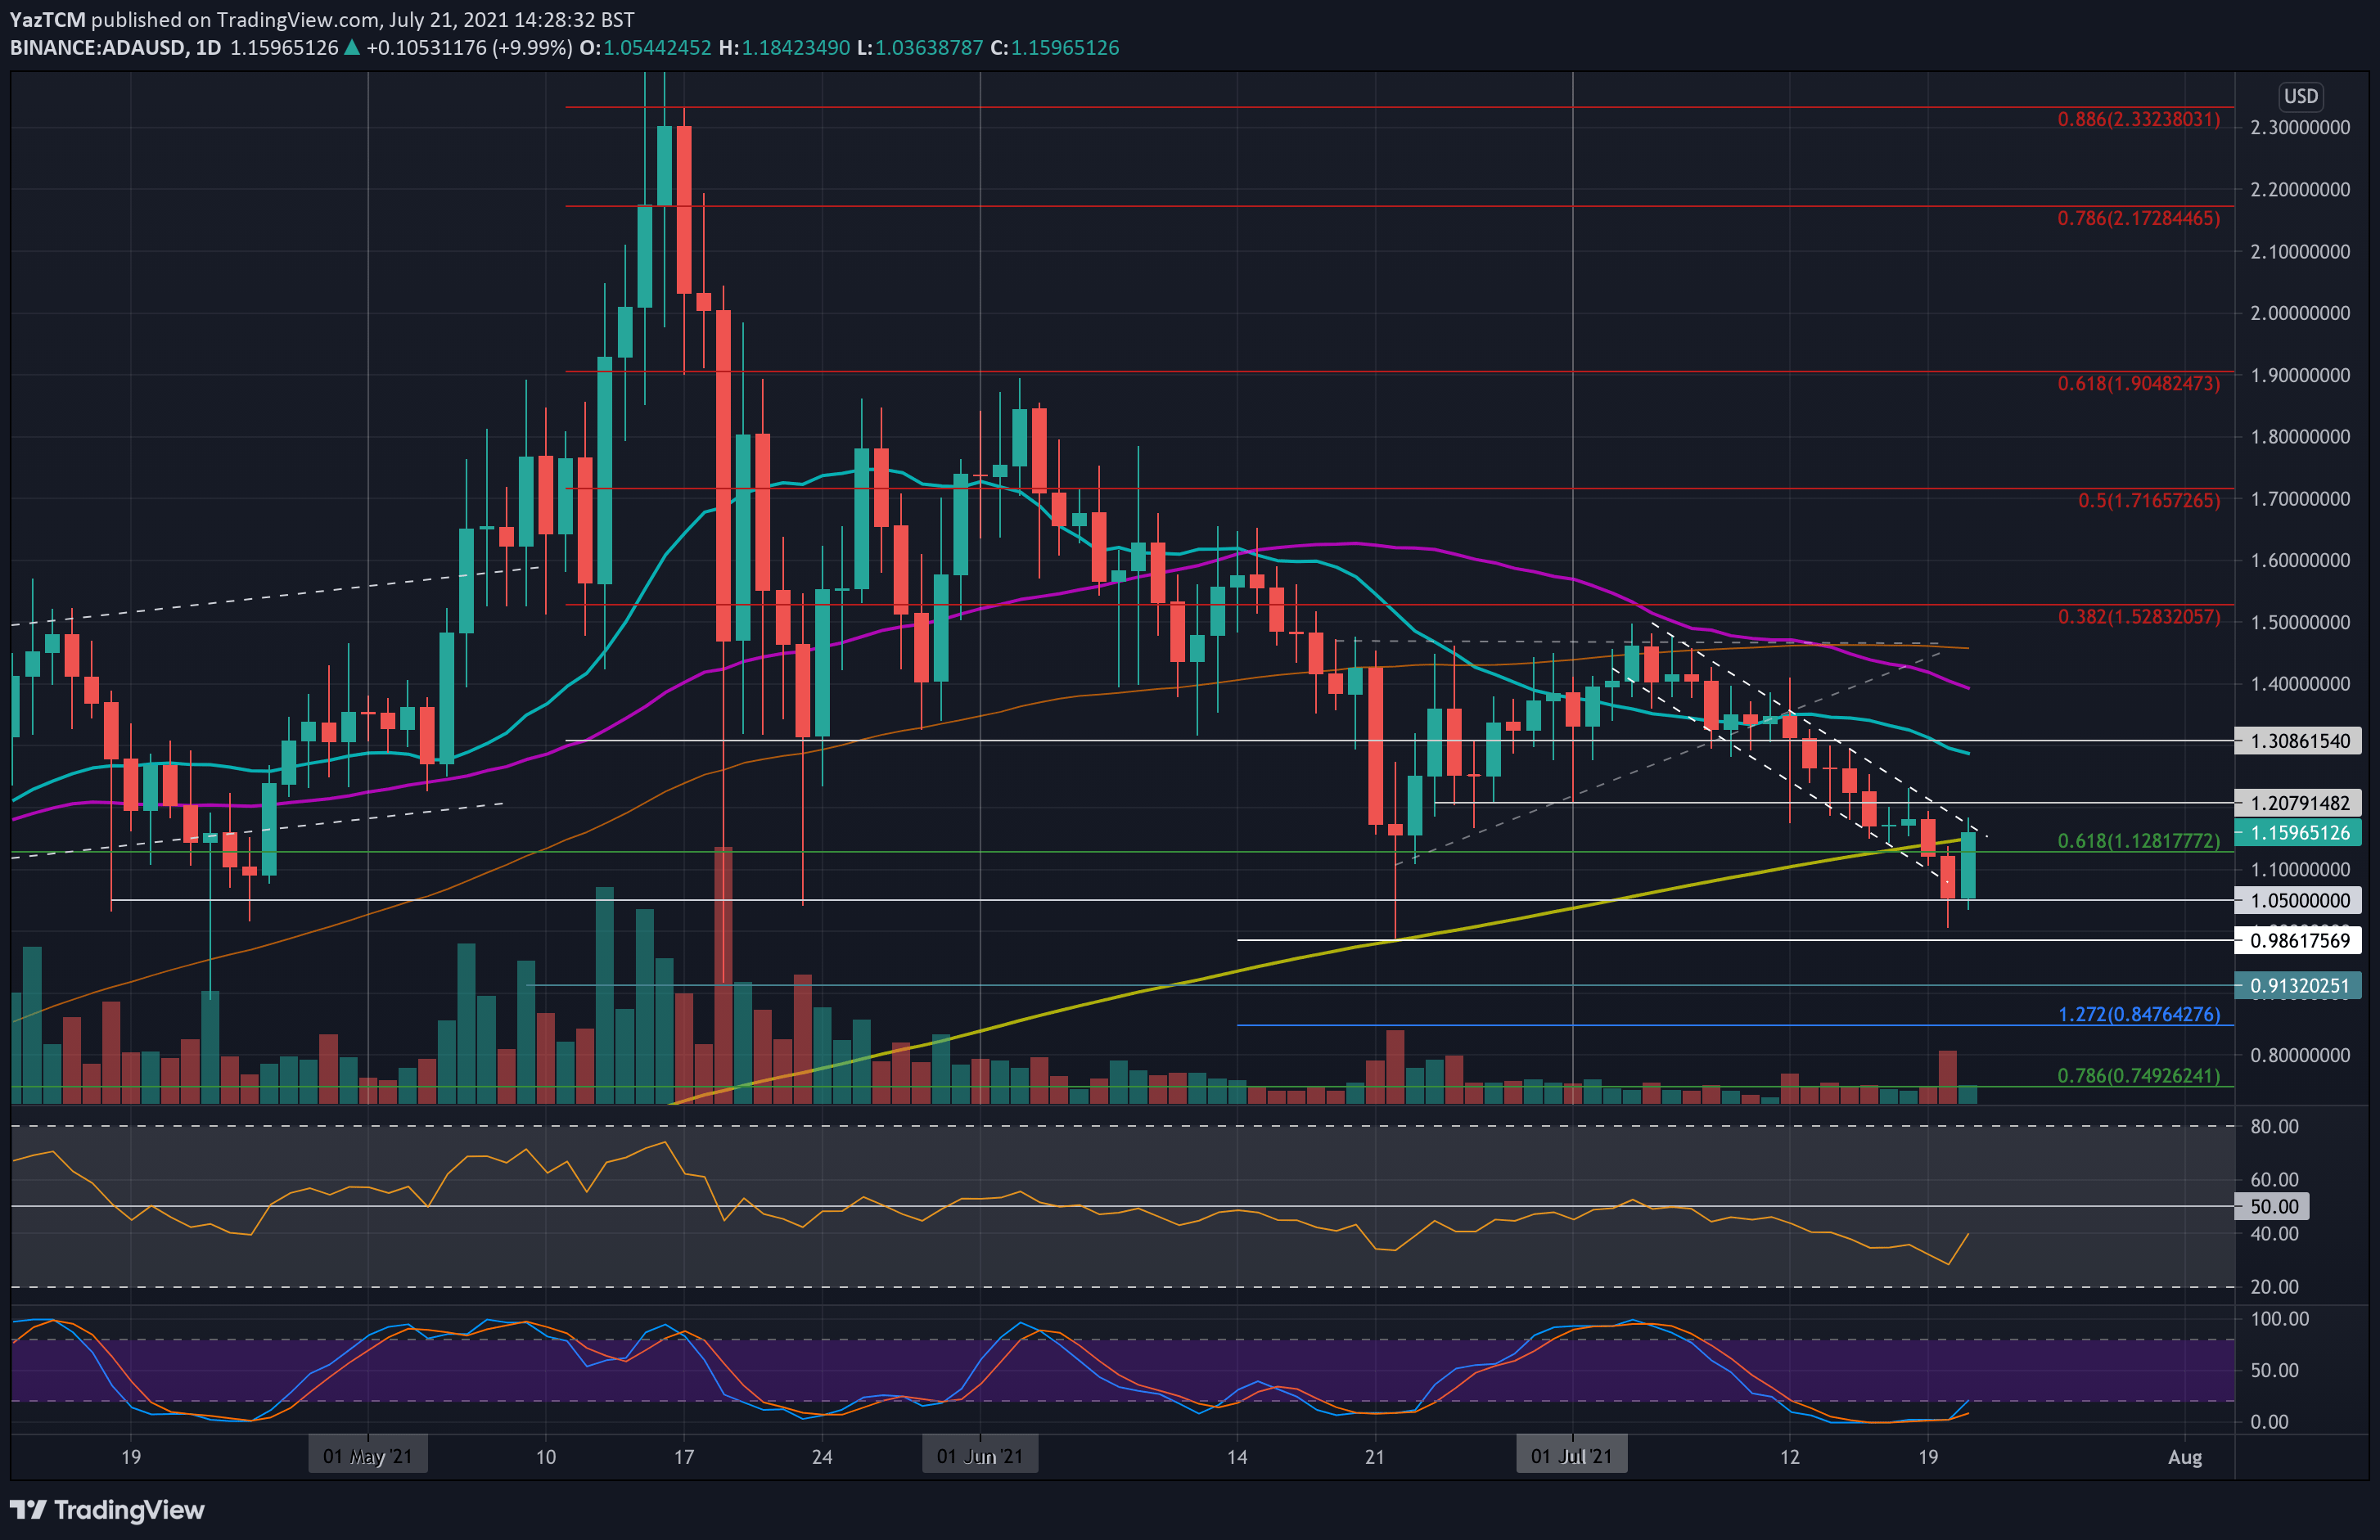
ADA/USD – ADA Rebounds Back Toward 200-day MA
Key Support Levels: $1.13, $1.10, $1.05.
Key Resistance Levels: $1.16, $1.20, $1.28.
The BTC price drop beneath $30K yesterday caused had many altcoins to follow suit. During the decline, ADA dropped below the 200-day MA and eventually broke beneath the descending price channel that it was trading within.
It continued to decline and reached as low as $1 before rebounding to close the daily candle at around $1.05.
Today, ADA surged by a strong 12% as it pushed upward from $1.05, reaching as high as $1.18. It is now back above the 200-day MA and is battling the upper angle of the previous descending price channel it was trading inside.
 ADA/USD Daily Chart. Source: TradingView.
ADA-USD Short Term Price Prediction
Looking ahead, if the bulls can break beyond $1.16 to penetrate the price channel, the first resistance lies at $1.20. This is followed by $1.28 (20-day MA), $1.30, and $1.40 (50-day MA).
On the other side, the first support lies around $1.13 (200-day MA). This is followed by $1.10, $1.05, and $1.00.
The RSI is in bearish territory but is pointing upward, indicating the bearish momentum might be fading.
ADA/BTC – ADA Continues To Trade Inside Price Channel
Key Support Levels: 3600 SAT, 3540 SAT, 3440 SAT.
Key Resistance Levels: 3700 SAT, 3900 SAT, 4000 SAT.
ADA remains within the price channel it has been trading in since the first week of July. The coin did drop below the 100-day MA at 3600 SAT yesterday to as low as 3440 SAT.
There, it found support at a .5 Fib and rebounded to close the daily candle inside the price channel at 3540 SAT, the June low-day closing price. Today, ADA pushed higher and is now testing the upper angle of the price channel around 37000 SAT.
 ADA/BTC Daily Chart. Source: TradingView.
ADA-BTC Short Term Price Prediction
Moving forward, if the bulls break the price channel at 3700 SAT, the first resistance lies at 3820 SAT – late June support. This is followed by 3900 SAT (20-day MA) and 4000 SAT (50-day MA).
On the other side, the first support lies at 3600 SAT (100-day MA). This is followed by 3540 SAT and 3440 SAT (.5 Fib).
Again the RSI is in the bearish favor, but the recent uptick could suggest diminishing bearish momentum.