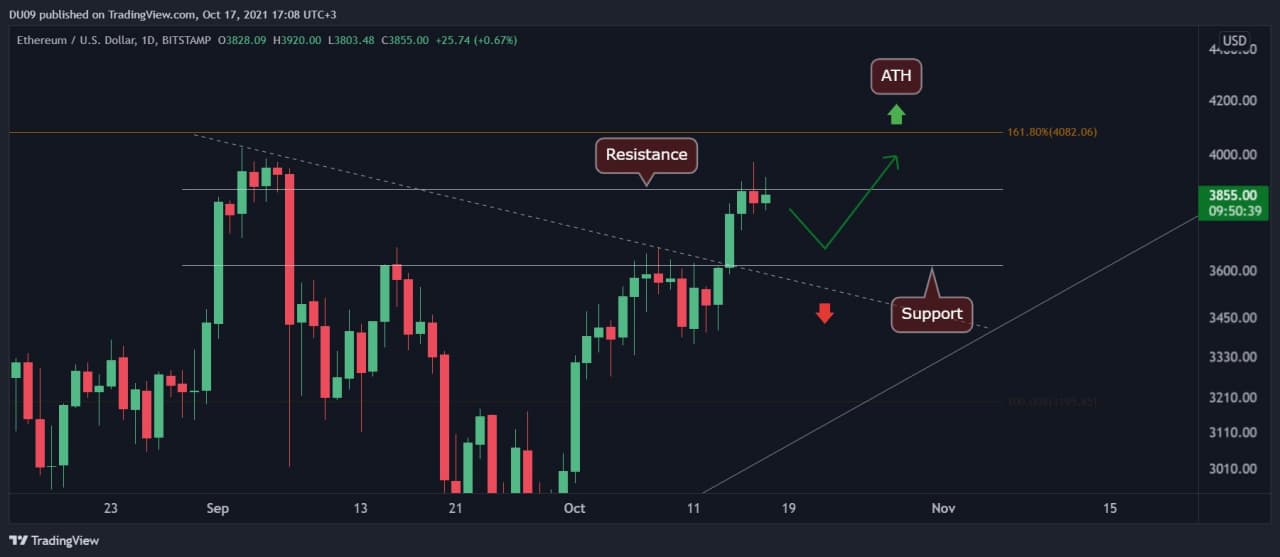
Key Support level: $3,600
Key Resistance level: $3,900
Over the weekend, the second-largest cryptocurrency has consolidated just under the current resistance range of $3,900.
However, similarly to Bitcoin, before ETH attempts to break its current all-time high at $4,380, it could retest the key support level as shown in the following ETH/USD chart. In case of a retest to confirm the $3600 level as support, ETH’s price might surpass $4,000 before the end of the month. However, a breakdown of the level will invalidate this.
Indicators
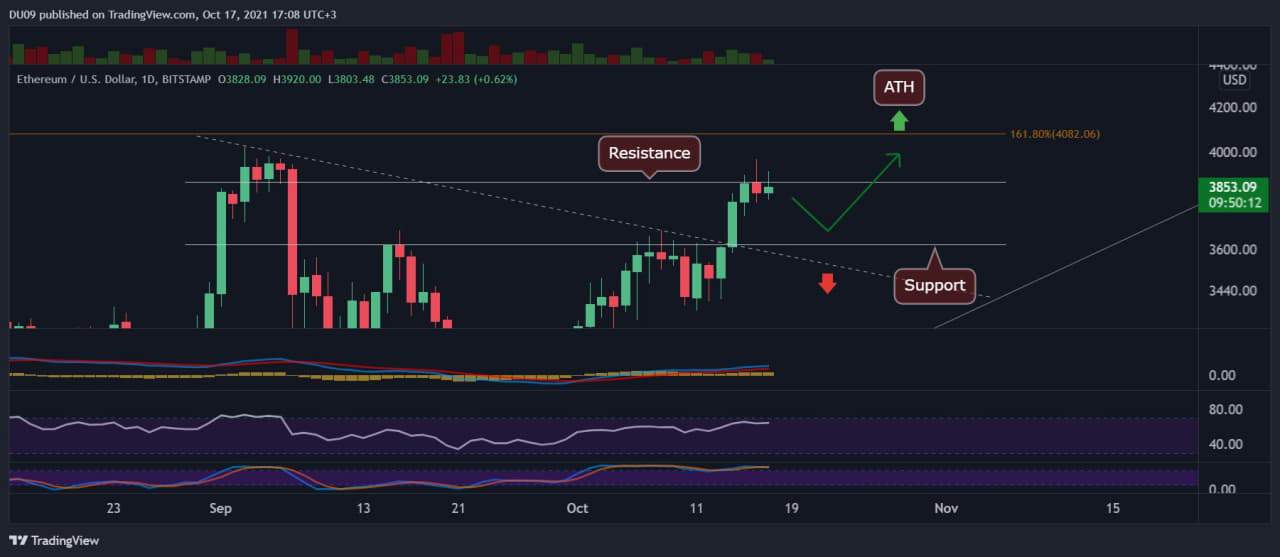
Trading Volume: Due to the weekend, the trading volume in the past two days has decreased; this is typical. However, watch the price action on Monday closely, especially the volatility expected surrounding Bitcoin’s ETF possible start of trading, which will likely affect the other cryptocurrencies.
RSI: On the daily timeframe, the RSI remains bullish. However, on the 4-hour timeframe, RSI is declining, which might support the idea of a short-term pullback to the support level as mentioned above.
MACD: Similarly to the RSI, MACD on the 4-hour timeframe has turned bearish. This reinforces the bias that ETH can retest its support before further price increase can be expected.
Bias
Over the long term, the ETH bias remains very bullish. However, the price is likely to retest the critical support level at $3,600 before a possible attempt at breaking the all-time high price range.
Therefore, in the immediate term, we might expect a pullback or correction. As mentioned, Monday can determine how ETH behaves for the rest of the coming week.
Short-Term Price Prediction for ETH/USD
The current consolidation in the price range of $3,600 – $3,900 is expected to continue before any serious attempt at breaking the all-time high. A clear retest of support may be needed for bulls to have enough confidence to push the price of ETH above $4,000.

