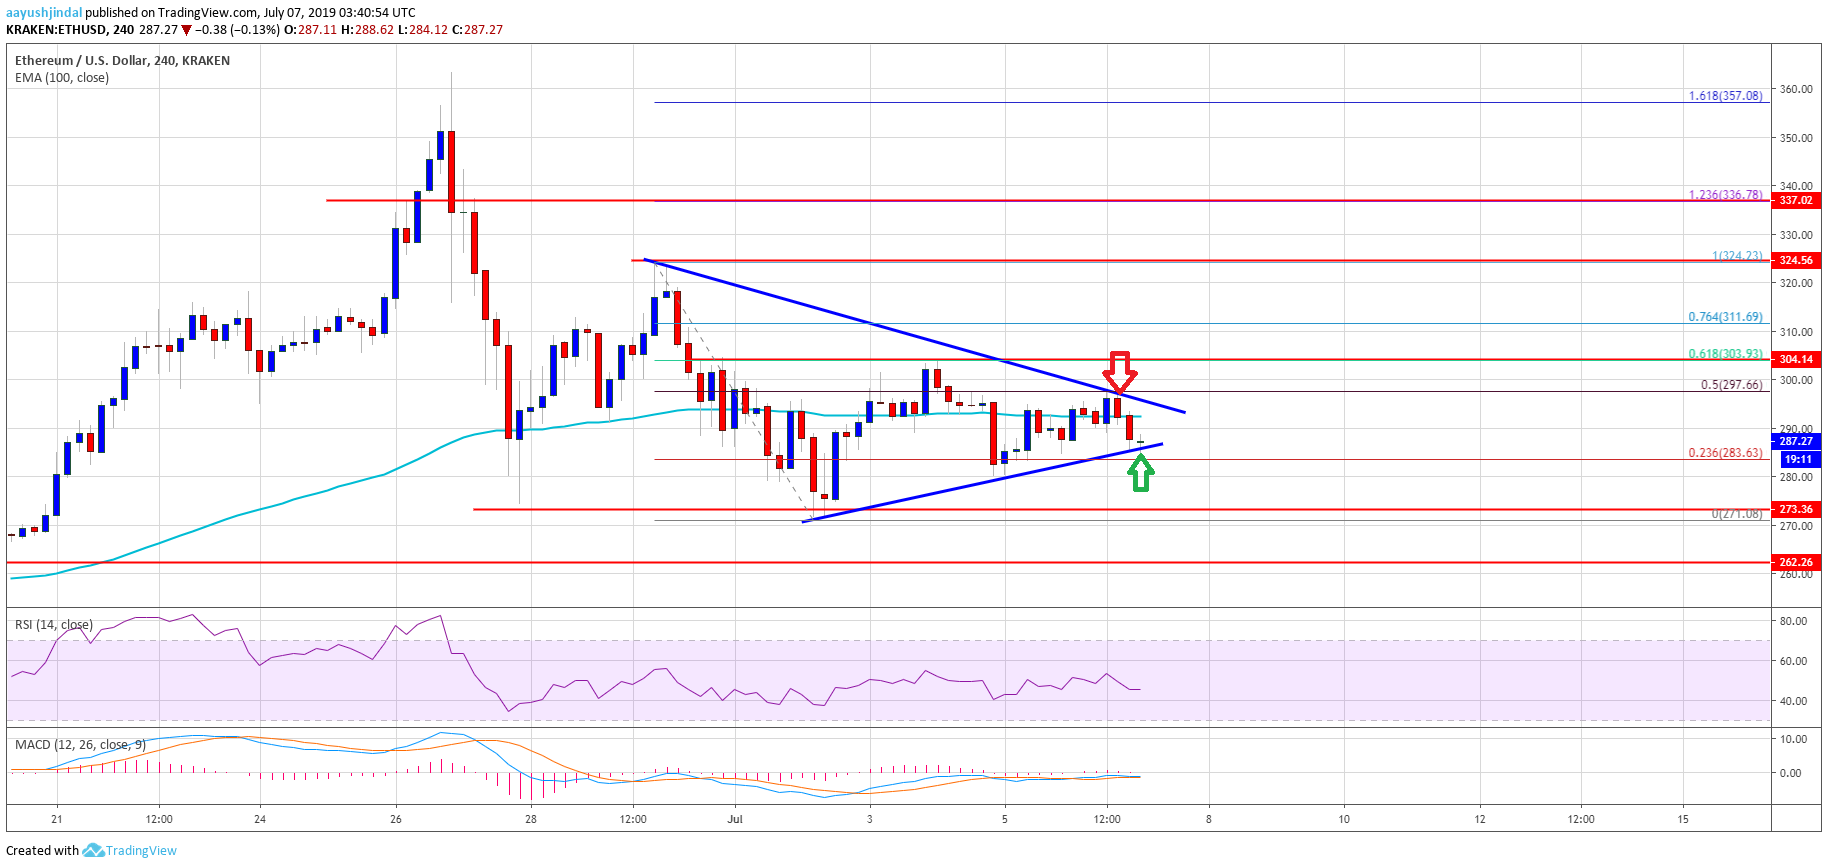
- ETH price stayed above the $270-275 support and recently recovered higher against the US Dollar.
- Bitcoin price is currently trading above $11,000, but it is struggling to gain bullish momentum.
- There is a key breakout pattern forming with resistance near $295 on the 4-hours chart of ETH/USD (data feed via Kraken).
- The pair could either surpass $295 and $300 or it could extend losses below the $280 and $275 supports.
Ethereum price is likely preparing for the next move against the US Dollar, similar to bitcoin. ETH might climb high sharply once it clears the $295 and $300 resistance levels.
Ethereum Price Weekly Analysis
This past week, Ethereum price retested the $270-275 support area against the US Dollar. The ETH/USD pair remained stable above $270 and formed a swing low near the $272 level. Later, there was an upside correction above the $280 and $290 resistance levels. Moreover, the price also climbed above the $300 resistance level and the 100 simple moving average (4-hours).
The price even surpassed the 50% Fib retracement level of the downward move from the $324 high to $272 low. However, the price struggled to stay above the $300 support level. It was rejected near the 61.8% Fib retracement level of the downward move from the $324 high to $272 low. Later, there was a minor downside reaction below the $295 support level.
Besides, the price is currently trading below the $295 level and the 100 simple moving average (4-hours). At the outset, there is a key breakout pattern forming with resistance near $295 on the 4-hours chart of ETH/USD. If there is an upside break above the $295 and $300 resistance levels, Ethereum price could continue to accelerate higher in the near term. The next stop for the bulls could be $305, followed by $320.
Conversely, if there is no upside break above $300, the price could decline below the $285 support level. If there is a downside break, there could be sharp losses below the $280 and $275 levels. In the mentioned case, the price may even slide below the $270 support area.
The above chart indicates that Ethereum price is preparing for the next key break either above the $300 barrier or below the $280 support area. Having said that, a clear break below the $270 support area won’t be easy in the coming sessions, whereas a close above $300 might accelerate gains.
Technical Indicators
4 hours MACD – The MACD for ETH/USD is slowly moving back in the bearish zone.
4 hours RSI – The RSI for ETH/USD is currently below the 50 level, with a few negative signs.
Major Support Level – $275
Major Resistance Level – $300
The post Ethereum Price Weekly Forecast: ETH Preparing For Next Key Break appeared first on NewsBTC.
