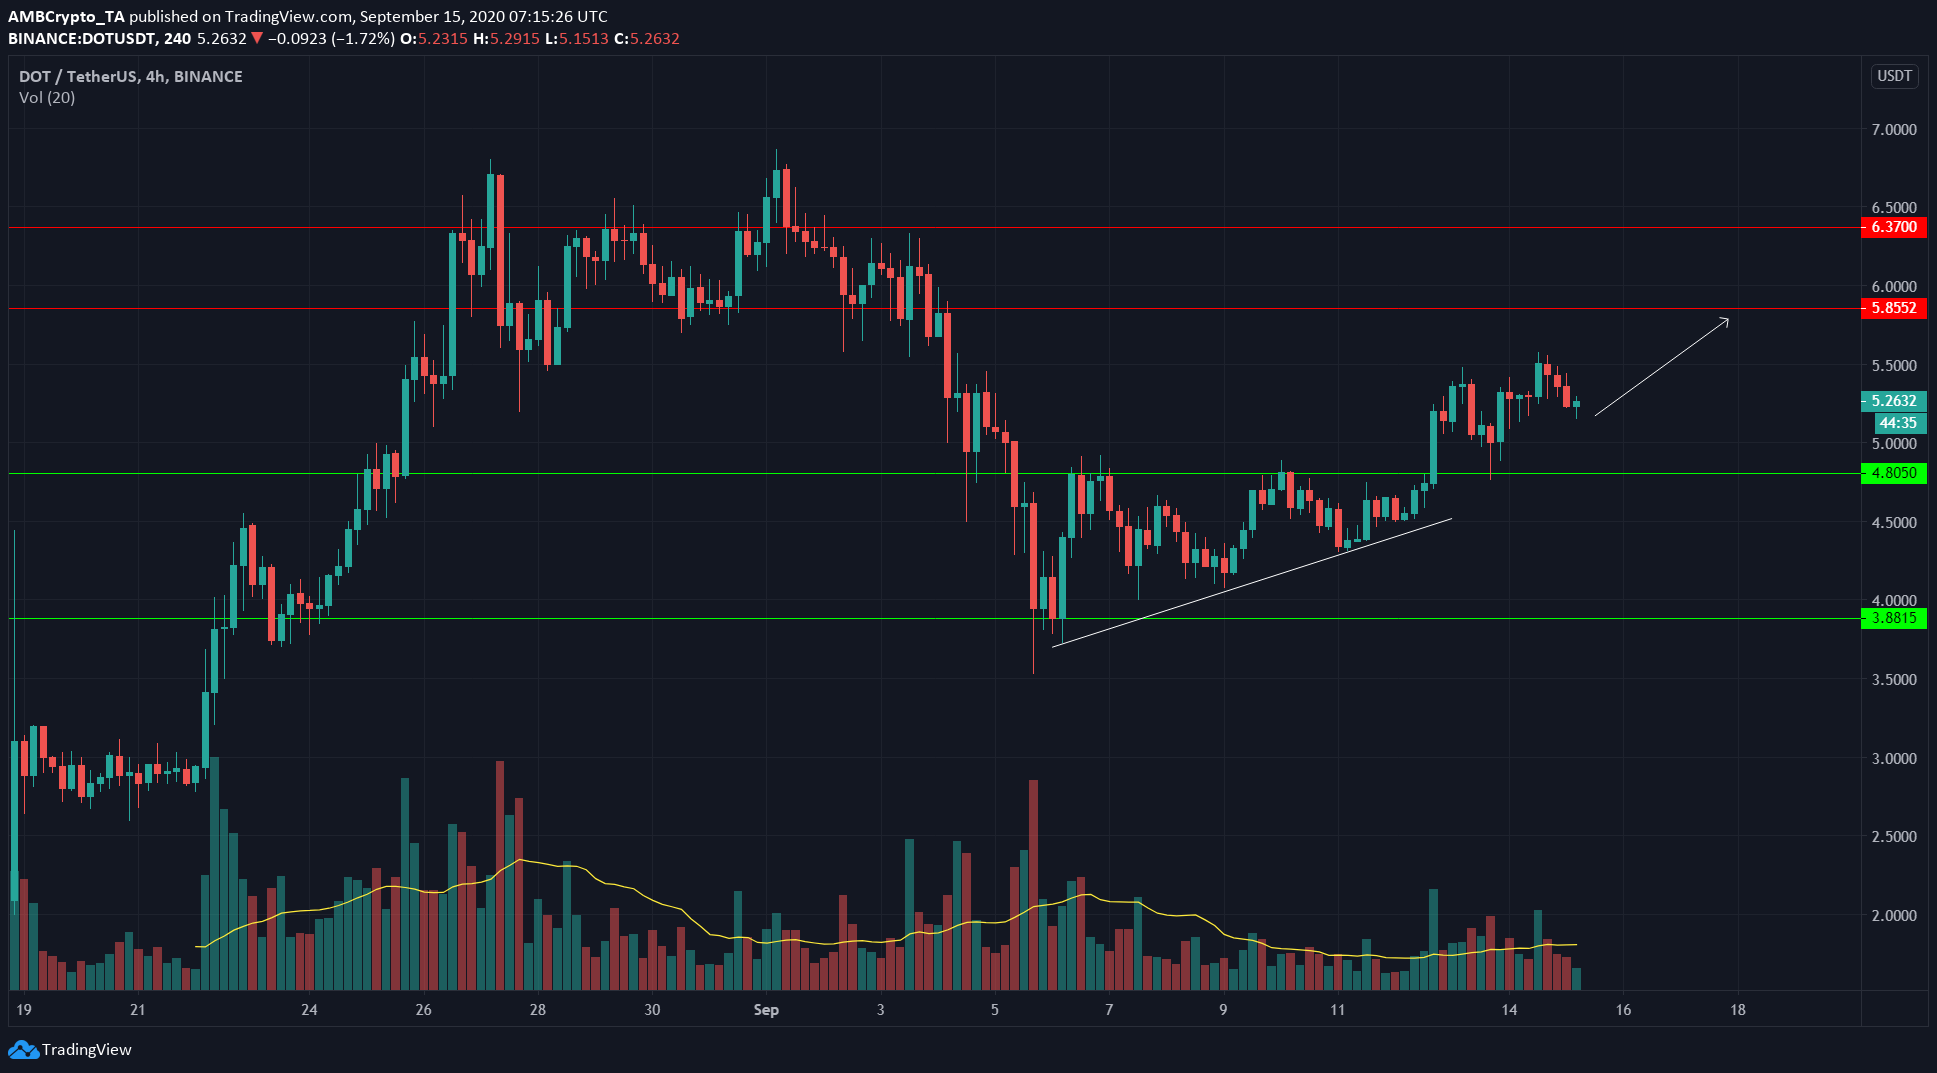
Bitcoin’s surge past $10,500 could have a positive effect on the rest of the market as the fear in the markets slowly evaporates. Polkadot confirmed a bullish pattern as it broke upward past the resistance and looked likely to surge further. Stellar Lumens found support on a near-term moving average but did not show any indications of halting its downtrend. VeChain saw a drop in price after exhibiting a bearish divergence.
Polkadot [DOT]

Source: DOT/USDT on TradingView
Polkadot formed an ascending triangle as shown by the white trendline. The price broke out to the upside beyond resistance, flipped to support, at $4.8.
DOT targeted $5.8 in the short term. Not only is it the next zone of resistance, but also the triangle pattern has formed between $3.8 and $4.8, a $1 difference that is usually the upside projected target for this pattern.
The above-average trading volume also confirmed breakout upward.
The uptrend of DOT saw it ranked fifth on CoinMarketCap, with a capitalization of $4.48 billion.
Stellar Lumens [XLM]

Source: XLM/USD on TradingView
XLM was trading at $0.08 at the time of writing, using its 50 SMA (yellow) as support. XLM would need to bounce off the moving average support and beyond the white trendline, to begin recovery.
The next level of support lies at $0.075 for the asset. It would be a bearish sign if price tested this level once more, as it would then be likely to form a descending triangle, a bearish continuation pattern.
VeChain [VET]

Source: VET/USD on TradingView
VET formed a hidden bearish divergence, highlighted in an earlier analysis. The divergence saw VET drop from $0.014 to $0.012 before staging a recovery.
At the time of writing, RSI was at 54. VET has formed higher lows over the past week which indicated an uptrend over the past week. But VET could see its gains unmade if it does not close above its most recent high at $0.014.
The post Polkadot, Stellar Lumens, VeChain Price Analysis: 15 September appeared first on AMBCrypto.